
By: Jay Campbell
Blog 3 Drag Reduction Studies using the Chung Method
We are all in search of ‘free speed’: cycling faster at our current fitness level. For time trialists it is all about reducing aerodynamic drag. For gravel racers, reducing rolling resistance predominates. But how do you know if an equipment change or body-position change is faster for YOU?
This is a blog in three Parts: 1) The Chung Method, 2) Rolling Resistance on Gravel, and 3) Aerodynamic Drag on Pavement. You can skip to the topic of interest, but the blogs build on each other.
This is Part 3 of three blogs on the reduction of drag and rolling resistance using the Chung Method. Part 1 briefly explained the Chung method and why I have confidence in its results. Part 2 provided an example of using the Chung Method to test rolling resistance on gravel. This blog will show the application of the Chung Method to determine the optimal aerodynamic hydration system for my set-up.
I recently published a blog showing watts/CdA to be the quantity to be optimized for flat time-trialing. CdA is the coefficient of drag and is a function of rider position and bike characteristics. The blog provided a graphical method to find your CdA using time-trial data.
CdA is notoriously hard to measure. Expensive wind tunnel testing has long been the only reliable method of accurately measuring CdA. The advent of power meters gave more possibilities for amateur measurement of CdA. I wrote about one of those, AeroTune, in a prior blog. More recently I have used the Chung Method to measure rolling resistance on my gravel bike (See Part 2). The Chung method not only appears to be very sensitive to changes in CdA, but its visual representation of test data provides a good double-check on the accuracy of the data.
Example: Determine how different hydration systems affect CdA.
I tested four different “hydration system” setups on my triathlon bike to determine which had the lowest CdA. They are described and shown below.
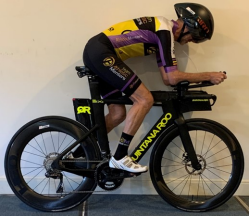
1) BASELINE This is my normal set-up. The hydration system is the integral front water bottle in the Quintana Roo PR series.

2) TORPEDO Addition of the XLabs Torpedo Versa 200 LINK to the Baseline setup.
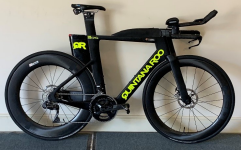
4) NO QROO BOTTLE This is the bike with no hydration system.
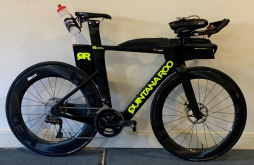
3) TORPEDO + DELTA Addition of the XLabs Delta 430 LINK to the Torpedo setup.
Testing Protocol:
Each test is 8 laps running back and forth on a 1/8th mile section of paved road. This section of road has a dip with about 15 feet of elevation on each side. The grade is steep enough that no brakes were used to make the U-turn. Shifting was minimized, using a high gear throughout the test. I used aero bars except for U-turns. Max speed was about 23 mph at the bottom of the dips and an average speed of 15 mph. Average watts was about 90 (one of the advantages of this method is that you do not need to wear yourself out to get good data.) The conditions were calm with winds at 3-4 mph (the back and forth nature of the test is designed to remove wind effects.) I used a calibrated Garmin Speed Sensor and double-sided Garmin Power Pedals. Each test was saved as a Garmin workout. All seven workouts were exported from Garmin Connect as TCX files and imported into Golden Cheetah [freeware available at this LINK . The seven workouts were combined and analyzed in the AeroLab Chart using the Chung Method (See Part 1).
Data Analysis
The chart below shows the entire test session as one continuous workout. I find this very appealing as I can visually gain some confidence that my data are accurate. If I have estimated the BASELINE CdA correctly, the BASELINE plot should just be an elevation profile of my ride. Because I am riding back and forth across a dip, the lower elevation should be the same for each lap, but the upper elevation should vary as the two sides of the dip are not at the same elevation. This is more visible in the second test. REMEMBER, this elevation data is not from GPS! This is from the Power Balance Equation that says IF I AM PUTTING IN THIS MUCH POWER AND SLOWING DOWN, I MUST BE GOING UPHILL (in simple terms.)
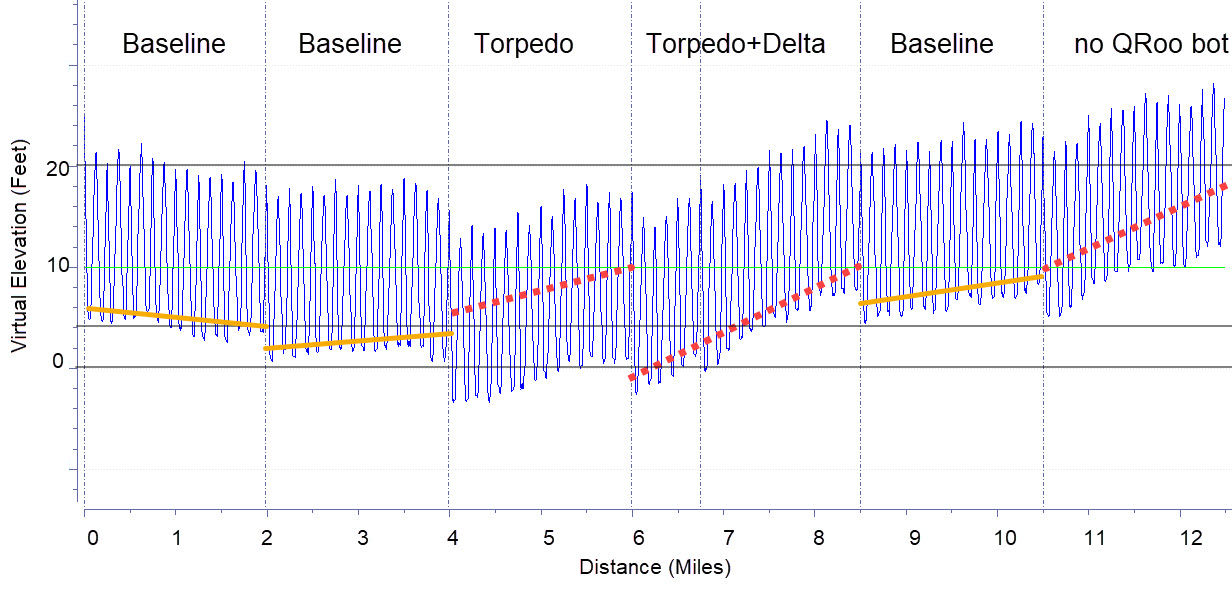
If the test is reproducible, all of the 3 BASELINE tests should be the same. The orange lines show the apparent slope trends of the BASELINE tests. The variation in the baseline slopes corresponds to about +/- 1 watt. Any conclusions are therefore subject to a +/- 1 watt error. That reproducibility is improved if the first test is discarded. That could be argued as legitimate, as I was just getting comfortable with the course and using many gear changes during that first test.
The red-dotted-line slopes are drawn for the 3 tests different from BASELINE. They are different and consistent enough to be considered significant. The data are saying that for that equipment configuration, additional power above baseline is required. That additional power is equivalent to the power needed to climb the slope of the red-dotted-line. In the case of the TORPEDO that converts to about 2 watts, for the TORPEDO + DELTA about 4 watts, and for the elimination of the QROO BOTTLE about 4 watts. All these results are +/- 1 watt accuracy.
Note that the TORPEDO+DELTA data was collected over 2 tests (3 laps, then 7 laps) as I had traffic interference. Despite that, the slopes of the two tests appear very similar, giving additional confidence in the reproducibility of the data.
Conclusions:
The Chung method of measuring changes in CdA is quite rugged and time efficient. The session above lasted 90 minutes including equipment changes. Each test took 8 minutes and was at an effort-level that was not exhausting.
The results confirm that aerodynamics are very dependent on the individual and on the specific bike design. For example, it cannot be generalized that a behind-the-seat water bottle reduces CdA for everyone. In my case, it appears that the Q Box behind my seat may be already doing some of the turbulence reduction that the bottle cage does for others.
The Chung method is simple and accurate enough that anyone with a speed sensor and power meter should be able to measure changes in CdA for different rider/bike configurations.
 Athletic Mentors