
By: Jay Campbell
We are all in search of ‘free speed’: cycling faster at our current fitness level. For time trialists it is all about reducing aerodynamic drag. For gravel racers, reducing rolling resistance predominates. But how do you know if an equipment change or body-position change is faster for YOU?
This is a blog in three Parts: 1) The Chung Method, 2) Rolling Resistance on Gravel, and 3) Aerodynamic Drag on Pavement. You can skip to the topic of interest, but the blogs build on each other.
EXAMPLE: Which of four hydration set-ups is most aerodynamic for me?
The results of 6 x 8-minute tests are strung together and can graphically answer this question (see below). No wind-tunnel required, only a power meter and a speed sensor. 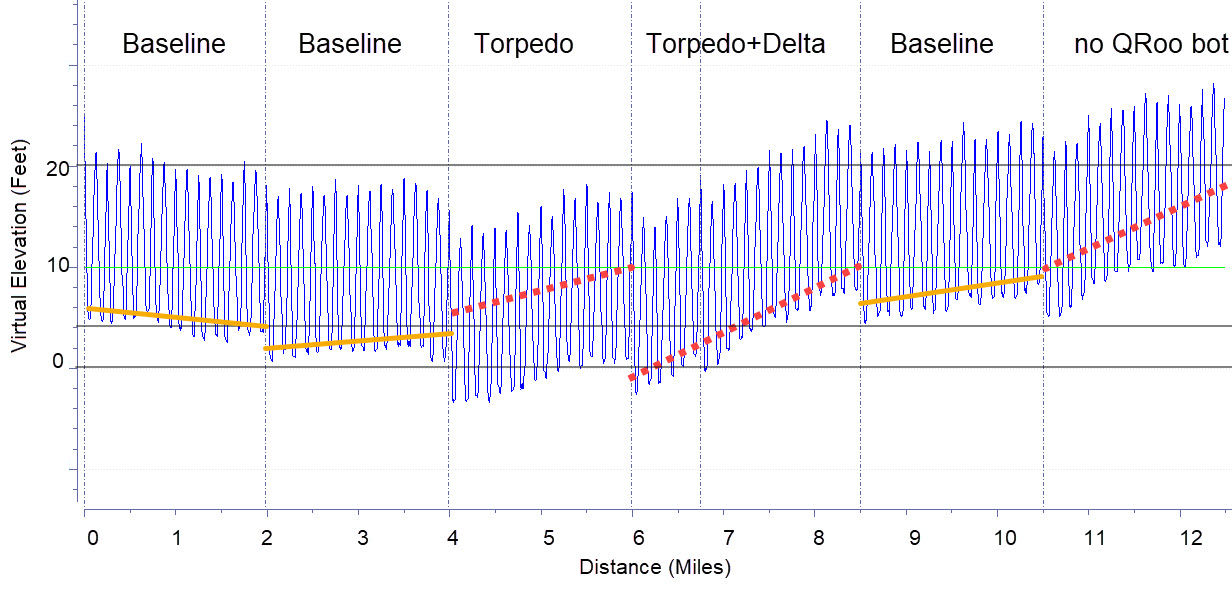
Blog 1 The Chung Method
This is Part 1 of three blogs on the reduction of drag and rolling resistance using the Chung Method. Part 1 briefly explains the Chung method and why I have confidence in its results.
The method was developed by Robert Chung, Professor at UC-Berkeley, a decent cyclist himself. The mathematical method is elegantly simple. It solves the Power Balance equation for SLOPE (s), using guesses for CdA and Crr (drag and rolling resistance).
The Math
The Power Balance says that the cyclist’s power is consumed by 4 components: 1) rolling resistance 2) changes in elevation 3) acceleration and 4) aerodynamic drag. It can be written mathematically as:
Power meter (watts) = Crr m g v + s m g v + m a v + ½ CdA ρ v³
v = speed (m/s)
m = mass of bike+cyclist (kg)
g = gravitation constant (9.81 m/sec²)
Crr = coefficient of rolling resistance
s = slope
a = acceleration
ρ = air density
CdA = aerodynamic drag area
Slope multiplied by velocity gives the change in elevation which are strung together and plotted. This elevation is referred to as “Virtual Elevation” as all of the unaccounted for “power” in the Power Balance, whether it is related to elevation gain or not, is converted to elevation. Chung gives a detailed description of his method here.
Testing Protocol
There are several ways to collect the data to answer drag and rolling resistance questions, but my experience has led me to the following protocol.
Equipment: Power meter (if pedals, two-sided is preferred), Speed Sensor (if you are testing tire pressures, calibrate sensor for each pressure), and a cycle-computer that will capture the power/speed data and export it as a tcx file.
Course: My preferred course is a dip in a quiet road that is about .2 miles across. The sides of the dip must be steep enough to slow you to a U-turn without braking. The Test: Start your cycle-computer from one side of the dip and do 5-7 back-and-forths, about 8-10 minutes. On the last length come to almost a complete stop without braking and stop your cycle-computer.
Test Order: I always start my testing with my preferred set-up which I call BASELINE. It has also become my practice to repeat the BASELINE as my second test. This gives me insight into the reproducibility of the results. The next two tests are modifications to my baseline set-up. My fifth test is another repeat of BASELINE.
Analysis
The tests are uploaded as tcx files into the freeware, Golden Cheetah. I like to paste all of the tests together so I can look at the entire session on one plot. Golden Cheetah performs the calculations to create a plot of Virtual Elevation versus Distance. The guesses of Crr and CdA can be adjusted until the elevation of the start and end of the Baseline tests are equal (zero slope). If the slope of a test is positive, more power is required for those test conditions (it is like ascending a virtual hill.) Conversely, if the slope of a test is negative, less power is required for those test conditions (it is like descending a virtual hill.) Example:
Why I like the Chung Method
- The Chung Method is Visual I have a lot more confidence in the result when I can see that there is a trend in the data and that the trend is consistent. I have used other methods where the test result is a number (for example CdA is x.xx). If I want a second confirmatory number, I need to do another test. To get the number of data points you see above would take a long long time. In the example above, each valley is the bottom of the dip. In this case I did 8 loops, so I have 16 data points for the elevation of the valley in each test. If that elevation was jumping all over the place, I would place little confidence in the results. The slopes of the 3 BASELINE tests do vary, which gives me an idea of the error involved in making any conclusions. I can also visually see that there are significant trends in the 3 non-BASELINE tests. I have estimated their slopes with red dotted lines.
- The Chung Method is robust I have performed a test where I just rode in circles in a parking lot in windy conditions with a single-sided power meter. The results were a bit ‘noisy’, but definite trends could be seen in the analysis.
- The Chung Method is not exhausting Some drag protocols require cycling for two kilometers at a high effort. Cycling the “dip” gets the cyclist to high speeds at the bottom using little energy.
- The Chung Method session for 4 variables can be done in less than 90 minutes The above example took about 75 minutes. Each test was 8 minutes. Getting ready for the next test took about 4 minutes. Considering the quality of the data from these 75 minutes, it was worth the time.
- The Chung Method can detect small changes My results showed that variations as low as one watt were significant. Chung says that with a bit of experience the variability of CdA measurements can be less than 0.5%
The next blog will discuss an actual example of the Chung method with Rolling Resistance on Gravel.
 Athletic Mentors