
By Jay Campbell
We are all in search of ‘free speed’: cycling faster at our current fitness level. For time trialists it is all about reducing aerodynamic drag. For gravel racers, reducing rolling resistance predominates. But how do you know if an equipment change or body-position change is faster for YOU?
This is a blog in three Parts: 1) The Chung Method, 2) Rolling Resistance on Gravel, and 3) Aerodynamic Drag on Pavement. You can skip to the topic of interest, but the blogs build on each other.
Blog 2 Rolling Resistance Studies using the Chung Method
This is Part 2 of three blogs on the reduction of drag and rolling resistance using the Chung Method. Part 1 briefly explained the Chung method and why I have confidence in its results. Part 2 provides an example of using the Chung Method to test rolling resistance on gravel.
In Part 1 we learned that the Power Balance equation can be solved for SLOPE using guesses for Crr and CdA (rolling resistance and drag). From the SLOPE data we can create a plot of Virtual Elevation. If we hold CdA constant, then any changes in the Virtual Elevation profile are due to changes in Crr.
Here is a virtual Elevation plot for 4 tests performed on gravel. Each test was 8 passes across a dip in a gravel road. The tests were all the same except for tire pressure.
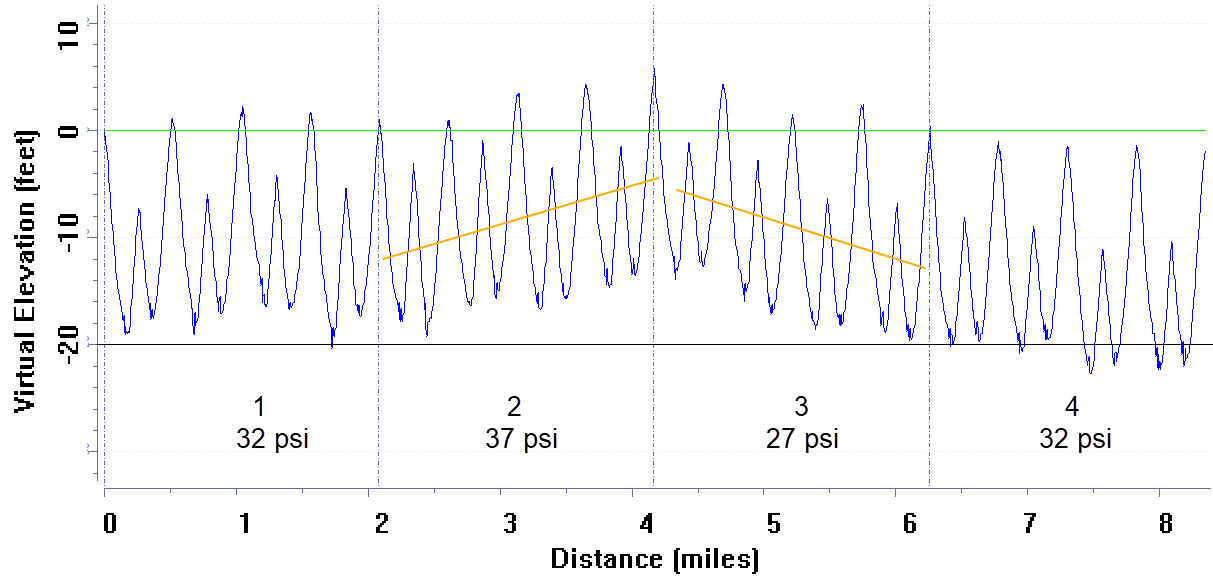
Each pass across the bottom of the dip in the road is a valley in the elevation profile. Each test had 8 passes across the dip. The Crr was chosen such that the two 32 psi tests had valley elevations that were similar across the test (slope of 0). It can be seen visually that the Crr chosen was not appropriate for the 37 psi or the 27 psi test. The higher pressure had a higher rolling resistance and the lower pressure a lower rolling resistance. This agrees qualitatively with tests I had performed earlier on a different test course.
There were some flaws in this test. 1) My pressure gauge was neither accurate nor precise. I have some doubts that the pressure in Test 1 was the same as Test 4. 2) There is a section of paved road at the bottom of the dip. This results in some noise in the data seen at the bottom of each data curve. 3) I only made 4 laps per test. More laps would give a better handle on variability in the data.
Despite those flaws, the test results provide valuable information that was obtained in a session that lasted less than an hour.
 Athletic Mentors