Athletic Mentors » Winter Triathlon Training: How to Stay Fit When the Weather Doesn’t Cooperate

Winter Triathlon Training: How to Stay Fit When the Weather Doesn’t Cooperate

February 27th, 2026 by JoAnn Cranson

By:  Raquel Torres

When winter arrives, many triathletes instinctively slow down or take a long break from training. Cold temperatures, snow, short days, and icy roads can make motivation hard to find. But winter doesn’t have to derail your progress. In fact, it can be one of the most productive training seasons of the year — if you approach it the right way.

The key to winter training is adaptation. Instead of fighting the weather, use it to focus on areas that are often neglected during race season: technique, strength, and consistency.

Swim: Build Technique, Not Just Fitness

Winter is the perfect time to work on swimming technique. With fewer races on the calendar, you can slow things down and focus on body position, breathing, and efficiency. Swimming is highly technical, and small improvements in form can lead to significant gains later. Even one or two focused swim sessions per week can make a noticeable difference when race season returns.

Winter is where champions are built while everyone else is resting.”

Flexibility: The Secret to a Smoother, Faster Swim Stroke

Flexibility is often overlooked in swimming, but it’s key to efficiency and injury prevention. Greater shoulder, hip, and ankle mobility enables you to reach farther, rotate more effectively, and maintain a streamlined position in the water. The result? Less drag, more power, and faster swimming with less effort. Incorporating regular flexibility exercises or stretching routines into your training can significantly improve your stroke, range of motion, and overall swimming performance.

Now, with more experience, I swim faster and with better endurance than I did in 2013. Focusing on technique in the winter has helped me refine my stroke and swim smarter, not just harder.

Bike: Indoor Training That Actually Works

Indoor bike training is one of the most effective ways to improve cycling performance. Using a trainer lets you control intensity and focus on high-quality workouts instead of battling cold winds or unsafe roads. Platforms like Zwift make indoor riding far more engaging by adding virtual courses, races, and structured workouts. Winter is an ideal time to build power through shorter, high-intensity sessions that increase strength and efficiency.

Training indoors also offers an excellent opportunity to prepare for the heat. Riding in a controlled, warm environment while practicing proper hydration—even during winter—helps your body adapt and prepares you for warmer race conditions.

Run: Embrace the Treadmill

Running outside in winter isn’t always safe, especially on icy or snowy surfaces. The treadmill is a smart alternative that reduces injury risk and allows for consistent training. It’s also an excellent tool for improving running form and mental toughness. Speed intervals, steady pacing, and slight incline adjustments can make treadmill sessions challenging and effective.

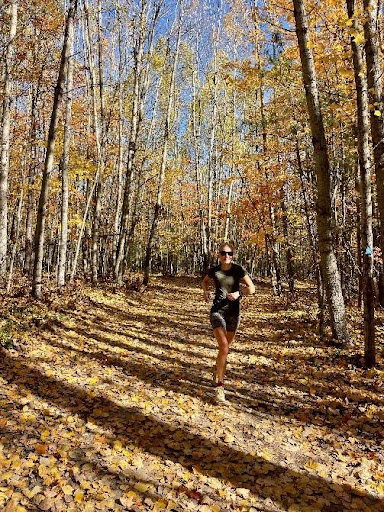
When conditions allow, outdoor runs are still valuable. Dress in layers or high-quality winter gear, warm up properly, and prioritize safety over distance or pace.

Compared with my early years, I’m now a faster, more efficient runner. Winter treadmill sessions helped me build speed and maintain consistency even when the weather was harsh.

Strength and Core: Build the Foundation

Winter is a strength season. Short, focused strength and core workouts improve stability, posture, and power transfer across all three disciplines. Even two brief sessions per week can help prevent injuries and make you a stronger, more resilient athlete.

Stay Motivated–Stay Disciplined

“Cold days reveal warm hearts and disciplined minds.”

Set small, achievable goals for each workout. Focusing on one skill or objective at a time keeps training purposeful and enjoyable. Remember, consistency matters more than perfection.

Winter isn’t a setback — it’s an opportunity. Train smart, stay consistent, and when spring arrives, you’ll be stronger, faster, and ahead of those who chose to wait.

“If you can train in winter, you can win in any season.”


From Couch to Triathlete

November 21st, 2025 by JoAnn Cranson

By:  Raquel Torres

🏁12-Week Beginner Road Map

Discover a 12-week beginner triathlon training plan that takes you from couch to finish line. Get sprint triathlon tips, workouts, and motivation for your first race.

Intro

You don’t need to be an elite athlete to embrace the title of triathlete. We understand that starting from scratch or returning to fitness can feel overwhelming, but completing a triathlon is within your reach. With a bit of patience, a solid plan, and unwavering faith in yourself, you can achieve this goal.

This 12-week beginner triathlon training plan will gently guide you toward crossing the finish line of your first sprint triathlon, a welcoming and attainable starting point for those new to the sport. Remember, it’s about progress, not perfection, and we’re here to support you on this exciting journey.

What Is a Sprint Triathlon?

A sprint triathlon usually includes:

  • 🏊 Swim: 750 meters
  • 🚴 Bike: 20 kilometers
  • 🏃 Run: 5 kilometers

It’s a fun, manageable way to enter the triathlon world. Most first-timers train about 4–6 hours per week, focusing on steady progress rather than perfection.

💡 You don’t need fancy gear; just commitment and a plan.

Example of a 12-week Training Plan.

To keep things simple and sustainable, the training is divided into three phases: Base, Build, and Race Readiness.

🏗️ Phase 1 (Weeks 1–4): Build Your Base

Goal: Get comfortable with consistent movement and build aerobic fitness.

Weekly Sample Schedule:

  • Swim: 2×/week (10–15 min continuous, focus on technique)
  • Bike: 2×/week (30–45 min easy pace)
  • Run/Walk: 2×/week (20–25 min alternating jog/walk)
  • Rest: 1 full day off

Tips:

  • Focus on breathing and smooth form in the pool.
  • Ride or run with a friend to stay motivated.
  • Record your workouts to see progress over time.

💪 Phase 2 (Weeks 5–8): Build Strength & Endurance

Goal: Boost stamina and introduce “brick” workouts, back-to-back bike and run sessions.

Weekly Sample Schedule:

  • Swim: 2×/week (technique + endurance up to 20–35 min)
  • Bike: 2×/week (one steady ride, one longer endurance ride)
  • Run: 2×/week (include one short brick run after biking)
  • Strength: 1×/week (core and body weight strength)

Tips:

  • Fuel during longer rides (a banana or small gel works).
  • Prioritize sleep and recovery.
  • Expect fatigue; that’s adaptation in progress.

🚦 Phase 3 (Weeks 9–12): Race Readiness

Goal: Simulate race conditions and build confidence for the big day.

Weekly Sample Schedule:

  • Swim: Try open-water sessions; complete full race distance
  • Bike: One long ride (75–90 min) + one shorter intensity session
  • Run: One steady run + one brick run off the bike
  • Transitions: Practice your setup (swim → bike → run)

Race Week Checklist:

  • Reduce training by 30–40% (taper).
  • Stay hydrated and eat familiar foods.
  • Visualize your race from start to finish.

Race Day: You’ve Got This

Feeling nervous? Totally normal. You’ve already done the hard part, the training.

Quick Race-Day Tips:

  • Arrive early to set up your transition zone.
  • Start your swim slow, find your rhythm.
  • Ride steady; save energy for the run.
  • Smile across the finish line, you’re officially a triathlete!

After the Finish Line

Take a moment to celebrate what you’ve accomplished.

Reflect on your training, rest, and start thinking about your next goal. Many new triathletes move from sprint to Olympic-distance races once they catch the triathlon bug or develop a strong interest in triathlon.

Pro Tip:

Join a local triathlon club or online community, or hire a coach. Shared motivation maintains commitment, consistency, and inspiration.

🧭 How to choose & prioritize your gear

  • If the budget is limited, start with a bike + helmet + running shoes + swim goggles/cap. Then add items as you go.
  • Make sure everything fits, and you’ve practiced with it: e.g., try your wetsuit in training, wear your TRI suit for a bike-then-run workout so you know it’s comfortable. 
  • For your first race: focus on reliability over flashiness. A well-serviced regular bike + helmet + running shoes + cap/goggles will get you across the finish line.
  • Keep a “transition bag” or checklist so you have all your little items (sunscreen, nutrition, towel, change clothes) organized.

Final Thoughts

Training for your first triathlon might seem intimidating, but with a clear plan, realistic goals, and a positive mindset, it’s 100% achievable.

In just 12 weeks, you can go from sitting on the couch to crossing your first triathlon finish line; proud, confident, and ready for more.

So grab your calendar, bookmark this plan, and take that first step.

Because the only thing between you and becoming a triathlete… is starting. 🏅

🪶Raquel Torres, MBA

🔗www.raqueltorres.org

📩raquel@athleticmentors.com


Reduce Aero Drag and Rolling Resistance using the Chung Method – Part #3

November 11th, 2025 by JoAnn Cranson

By: Jay Campbell

Blog 3 Drag Reduction Studies using the Chung Method 

We are all in search of ‘free speed’: cycling faster at our current fitness level. For time trialists it is all about reducing aerodynamic drag. For gravel racers, reducing rolling  resistance predominates. But how do you know if an equipment change or body-position  change is faster for YOU? 

This is a blog in three Parts: 1) The Chung Method, 2) Rolling Resistance on Gravel, and 3)  Aerodynamic Drag on Pavement. You can skip to the topic of interest, but the blogs build on  each other. 

This is Part 3 of three blogs on the reduction of drag and rolling resistance using the Chung  Method. Part 1 briefly explained the Chung method and why I have confidence in its results. Part 2 provided an example of using the Chung Method to test rolling resistance on gravel. This blog will show the application of the Chung Method to determine the optimal  aerodynamic hydration system for my set-up.

I recently published a blog showing watts/CdA to be the quantity to  be optimized for flat time-trialing. CdA is the coefficient of drag and is a function of rider  position and bike characteristics. The blog provided a graphical method to find your CdA  using time-trial data. 

CdA is notoriously hard to measure. Expensive wind tunnel testing has long been the only  reliable method of accurately measuring CdA. The advent of power meters gave more  possibilities for amateur measurement of CdA. I wrote about one of those, AeroTune, in a prior blog. More recently I have used the Chung  Method to measure rolling resistance on my gravel bike (See Part 2). The Chung method not only appears to be very sensitive to changes in CdA, but its visual representation of test data provides a good double-check on the accuracy of the data. 

Example: Determine how different hydration systems affect CdA. 

I tested four different “hydration system” setups on my triathlon bike to determine which  had the lowest CdA. They are described and shown below.

1) BASELINE This is my normal set-up. The hydration system is the integral front water bottle in the Quintana Roo PR series.

2) TORPEDO Addition of the XLabs Torpedo Versa 200 LINK  to the Baseline setup.


4) NO QROO BOTTLE This is the bike with no hydration system.

3) TORPEDO + DELTA Addition of the XLabs Delta 430 LINK  to the Torpedo setup.


Testing Protocol: 

Each test is 8 laps running back and forth on a 1/8th mile section of paved road. This  section of road has a dip with about 15 feet of elevation on each side. The grade is steep  enough that no brakes were used to make the U-turn. Shifting was minimized, using a high  gear throughout the test. I used aero bars except for U-turns. Max speed was about 23 mph  at the bottom of the dips and an average speed of 15 mph. Average watts was about 90  (one of the advantages of this method is that you do not need to wear yourself out to get  good data.) The conditions were calm with winds at 3-4 mph (the back and forth nature of  the test is designed to remove wind effects.) I used a calibrated Garmin Speed Sensor and  double-sided Garmin Power Pedals. Each test was saved as a Garmin workout. All seven  workouts were exported from Garmin Connect as TCX files and imported into Golden  Cheetah [freeware available at this LINK . The seven  workouts were combined and analyzed in the AeroLab Chart using the Chung Method (See  Part 1). 

Data Analysis 

The chart below shows the entire test session as one continuous workout. I find this very  appealing as I can visually gain some confidence that my data are accurate. If I have  estimated the BASELINE CdA correctly, the BASELINE plot should just be an elevation  profile of my ride. Because I am riding back and forth across a dip, the lower elevation  should be the same for each lap, but the upper elevation should vary as the two sides of  the dip are not at the same elevation. This is more visible in the second test. REMEMBER,  this elevation data is not from GPS! This is from the Power Balance Equation that says IF I  AM PUTTING IN THIS MUCH POWER AND SLOWING DOWN, I MUST BE GOING UPHILL (in  simple terms.)

If the test is reproducible, all of the 3 BASELINE tests should be the same. The orange lines  show the apparent slope trends of the BASELINE tests. The variation in the baseline slopes  corresponds to about +/- 1 watt. Any conclusions are therefore subject to a +/- 1 watt error.  That reproducibility is improved if the first test is discarded. That could be argued as  legitimate, as I was just getting comfortable with the course and using many gear changes  during that first test. 

The red-dotted-line slopes are drawn for the 3 tests different from BASELINE. They are  different and consistent enough to be considered significant. The data are saying that for  that equipment configuration, additional power above baseline is required. That additional  power is equivalent to the power needed to climb the slope of the red-dotted-line. In the  case of the TORPEDO that converts to about 2 watts, for the TORPEDO + DELTA about 4  watts, and for the elimination of the QROO BOTTLE about 4 watts. All these results are +/- 1  watt accuracy. 

Note that the TORPEDO+DELTA data was collected over 2 tests (3 laps, then 7 laps) as I had  traffic interference. Despite that, the slopes of the two tests appear very similar, giving  additional confidence in the reproducibility of the data. 

Conclusions: 

The Chung method of measuring changes in CdA is quite rugged and time efficient. The  session above lasted 90 minutes including equipment changes. Each test took 8 minutes  and was at an effort-level that was not exhausting. 

The results confirm that aerodynamics are very dependent on the individual and on the  specific bike design. For example, it cannot be generalized that a behind-the-seat water bottle reduces CdA for everyone. In my case, it appears that the Q Box behind my seat may  be already doing some of the turbulence reduction that the bottle cage does for others. 

The Chung method is simple and accurate enough that anyone with a speed sensor and  power meter should be able to measure changes in CdA for different rider/bike  configurations.


Reduce Aero Drag and Rolling Resistance using the Chung Method – Part #2

November 11th, 2025 by JoAnn Cranson

By Jay Campbell

We are all in search of ‘free speed’: cycling faster at our current fitness level. For time trialists it is all about reducing aerodynamic drag. For gravel racers, reducing rolling  resistance predominates. But how do you know if an equipment change or body-position  change is faster for YOU? 

This is a blog in three Parts: 1) The Chung Method, 2) Rolling Resistance on Gravel, and 3)  Aerodynamic Drag on Pavement. You can skip to the topic of interest, but the blogs build on  each other. 

Blog 2 Rolling Resistance Studies using the Chung Method 

This is Part 2 of three blogs on the reduction of drag and rolling resistance using the Chung  Method. Part 1 briefly explained the Chung method and why I have confidence in its results. Part 2 provides an example of using the Chung Method to test rolling resistance on gravel. 

In Part 1 we learned that the Power Balance equation can be solved for SLOPE using  guesses for Crr and CdA (rolling resistance and drag). From the SLOPE data we can create  a plot of Virtual Elevation. If we hold CdA constant, then any changes in the Virtual  Elevation profile are due to changes in Crr. 

Here is a virtual Elevation plot for 4 tests performed on gravel. Each test was 8 passes  across a dip in a gravel road. The tests were all the same except for tire pressure.

Each pass across the bottom of the dip in the road is a valley in the elevation profile. Each  test had 8 passes across the dip. The Crr was chosen such that the two 32 psi tests had  valley elevations that were similar across the test (slope of 0). It can be seen visually that  the Crr chosen was not appropriate for the 37 psi or the 27 psi test. The higher pressure  had a higher rolling resistance and the lower pressure a lower rolling resistance. This  agrees qualitatively with tests I had performed earlier on a different test course. 

There were some flaws in this test. 1) My pressure gauge was neither accurate nor precise.  I have some doubts that the pressure in Test 1 was the same as Test 4. 2) There is a section  of paved road at the bottom of the dip. This results in some noise in the data seen at the  bottom of each data curve. 3) I only made 4 laps per test. More laps would give a better  handle on variability in the data. 

Despite those flaws, the test results provide valuable information that was obtained in a  session that lasted less than an hour. 


What Trail Running Has Taught Me

November 11th, 2025 by JoAnn Cranson

By:  Paige Dolan

This past weekend, I raced The Legend Trail Half Marathon. I love running trails, but this was actually my first trail race. The race itself was so fun, but what I find even more enjoyable is running on trails for training. I’m a triathlete on AM’s Multisport Team, and I use trail running year-round to make me a better athlete. I wanted to share a few ways trail running can elevate your training too, no matter what you’re training for.

First, trail running is good for the body. I use trails to mix up the type of surface I’m running on. Dirt or gravel paths are much softer on the body, and it’s a welcome break from all the pavement pounding. Depending on the terrain, trail running also forces your stride to constantly adjust. This strengthens stabilizing muscles and improves balance.

Trails often include hills, which bring even more benefits. Rolling hills help build endurance and strength, while steeper climbs are perfect for developing power. On my runs, I’ll pick a steep hill and do four to six 30-second hill strides, jogging back down between each one to recover. The whole workout takes less than 10 minutes but makes a noticeable difference in power output over time. Plus, doing sprints uphill is easier on the body. You can generate a lot of force without the same level of impact as running hard on flat ground.

The physical benefits of trail running are great, but what keeps me coming back are the mental benefits. Trail running is peaceful. I love being surrounded by nature, the trees and the quiet. The scenery makes time fly by and always tempts me to go further to explore more. The terrain and views add much needed variety to training runs. 

It’s also a mental reset. We can all get caught up in our pace and data, but trail running takes that pressure off.  Running on trails is naturally slower with twists, turns, climbs and descents. Because of that, I find myself running more by feel and end up enjoying the workout more. It always makes me gain a bigger appreciation for the sport and helps me get out of training “ruts”.

I hope that this article has sparked some interest in exploring your local trails. Next time you’re feeling stuck in your same workout routine or wanting to build power go run on trails! A few of my favorites are Al Sabo, Kal-Haven trail, or the Vasa Trail system outside of Traverse City (pictured in this article). 


Reduce Aero Drag and Rolling Resistance using the Chung Method – Part #1

November 5th, 2025 by JoAnn Cranson

By:  Jay Campbell

We are all in search of ‘free speed’: cycling faster at our current fitness level. For time trialists it is all about reducing aerodynamic drag. For gravel racers, reducing rolling  resistance predominates. But how do you know if an equipment change or body-position  change is faster for YOU? 

This is a blog in three Parts: 1) The Chung Method, 2) Rolling Resistance on Gravel, and 3)  Aerodynamic Drag on Pavement. You can skip to the topic of interest, but the blogs build on  each other. 

EXAMPLE: Which of four hydration set-ups is most aerodynamic for me? 

The results of 6 x 8-minute tests are strung together and can graphically answer this  question (see below). No wind-tunnel required, only a power meter and a speed sensor.


Blog 1 The Chung Method 

This is Part 1 of three blogs on the reduction of drag and rolling resistance using the Chung  Method. Part 1 briefly explains the Chung method and why I have confidence in its results.

The method was developed by Robert Chung, Professor at UC-Berkeley, a decent cyclist  himself. The mathematical method is elegantly simple. It solves the Power Balance  equation for SLOPE (s), using guesses for CdA and Crr (drag and rolling resistance).  

The Math 

The Power Balance says that the cyclist’s power is consumed by 4 components: 1) rolling  resistance 2) changes in elevation 3) acceleration and 4) aerodynamic drag. It can be  written mathematically as: 

Power meter (watts) = Crr m g v + s m g v + m a v + ½ CdA ρ v³ 

v = speed (m/s) 

m = mass of bike+cyclist (kg) 

g = gravitation constant (9.81 m/sec²

Crr = coefficient of rolling resistance  

s = slope  

a = acceleration  

ρ = air density  

CdA = aerodynamic drag area 

Slope multiplied by velocity gives the change in elevation which are strung together and  plotted. This elevation is referred to as “Virtual Elevation” as all of the unaccounted for  “power” in the Power Balance, whether it is related to elevation gain or not, is converted to  elevation. Chung gives a detailed description of his method here.

Testing Protocol 

There are several ways to collect the data to answer drag and rolling resistance questions,  but my experience has led me to the following protocol. 

Equipment: Power meter (if pedals, two-sided is preferred), Speed Sensor (if you are testing  tire pressures, calibrate sensor for each pressure), and a cycle-computer that will capture  the power/speed data and export it as a tcx file. 

Course: My preferred course is a dip in a quiet road that is about .2 miles across. The sides  of the dip must be steep enough to slow you to a U-turn without braking.  The Test: Start your cycle-computer from one side of the dip and do 5-7 back-and-forths,  about 8-10 minutes. On the last length come to almost a complete stop without braking  and stop your cycle-computer. 

Test Order: I always start my testing with my preferred set-up which I call BASELINE. It has  also become my practice to repeat the BASELINE as my second test. This gives me insight  into the reproducibility of the results. The next two tests are modifications to my baseline  set-up. My fifth test is another repeat of BASELINE.

Analysis 

The tests are uploaded as tcx files into the freeware, Golden CheetahI like to paste all of the tests together so I can look at the  entire session on one plot. Golden Cheetah performs the calculations to create a plot of Virtual Elevation versus Distance. The guesses of Crr and CdA can be adjusted until the  elevation of the start and end of the Baseline tests are equal (zero slope). If the slope of a  test is positive, more power is required for those test conditions (it is like ascending a  virtual hill.) Conversely, if the slope of a test is negative, less power is required for those  test conditions (it is like descending a virtual hill.)                      Example: 

Why I like the Chung Method 

  1. The Chung Method is Visual I have a lot more confidence in the result when I can  see that there is a trend in the data and that the trend is consistent. I have used  other methods where the test result is a number (for example CdA is x.xx). If I want a  second confirmatory number, I need to do another test. To get the number of data  points you see above would take a long long time. In the example above, each valley  is the bottom of the dip. In this case I did 8 loops, so I have 16 data points for the  elevation of the valley in each test. If that elevation was jumping all over the place, I  would place little confidence in the results. The slopes of the 3 BASELINE tests do  vary, which gives me an idea of the error involved in making any conclusions. I can also visually see that there are significant trends in the 3 non-BASELINE tests. I have  estimated their slopes with red dotted lines.
  2. The Chung Method is robust I have performed a test where I just rode in circles in a  parking lot in windy conditions with a single-sided power meter. The results were a  bit ‘noisy’, but definite trends could be seen in the analysis. 
  3. The Chung Method is not exhausting Some drag protocols require cycling for two kilometers at a high effort. Cycling the “dip” gets the cyclist to high speeds at the  bottom using little energy.  
  4. The Chung Method session for 4 variables can be done in less than 90 minutes The  above example took about 75 minutes. Each test was 8 minutes. Getting ready for  the next test took about 4 minutes. Considering the quality of the data from these  75 minutes, it was worth the time. 
  5. The Chung Method can detect small changes My results showed that variations as  low as one watt were significant. Chung says that with a bit of experience the variability of CdA measurements can be less than 0.5%

The next blog will discuss an actual example of the Chung method with Rolling Resistance  on Gravel.


  • Contact Us

    Athletic Mentors
    269.743.2277

    8610 North 32nd St - P.O. Box 641 - Richland, MI 49083